Calculate Parameters#
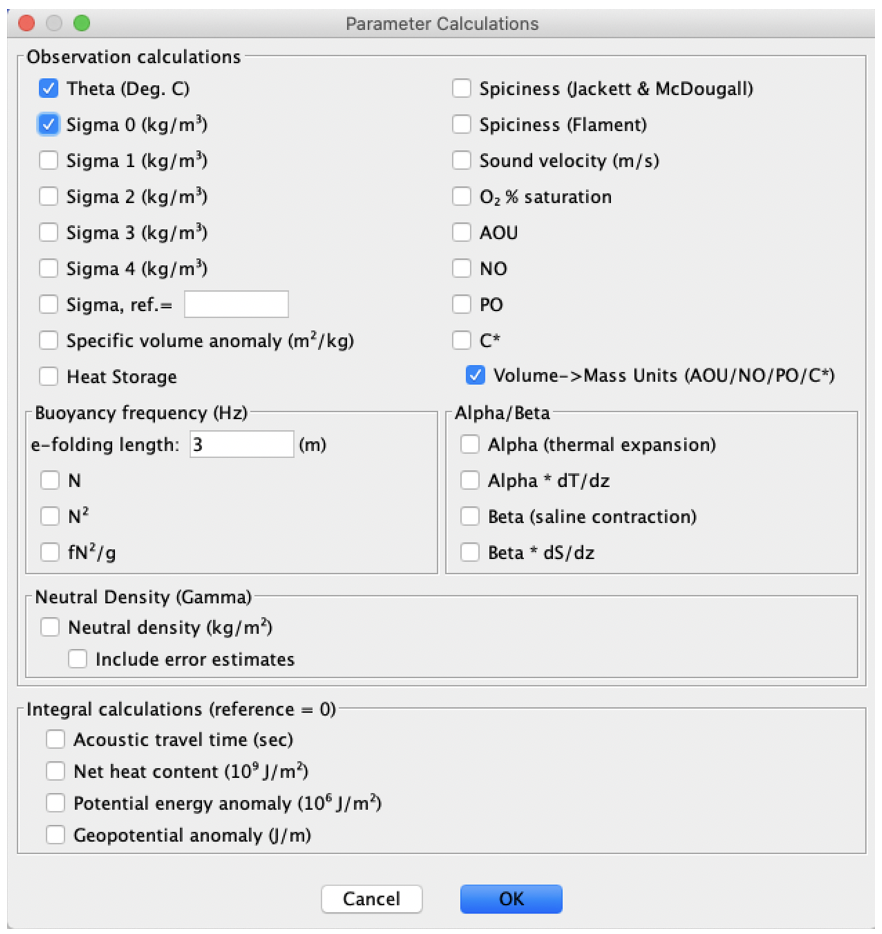
Oceanographers use parameters calculated from the data to aid interpretation. Java OceanAtlas provides means to calculate a wide range of these derived variables. Calculated parameters are usually re-calculated each time the data set is opened. This is usually not a problem because parameter calculations in OceanAtlas are completed easily and quickly. Selecting ‘Parameters…’ from the Calculations menu brings up the Parameter Calculations dialog box (Fig. 8).

Fig. 8 Java OceanAtlas Parameter Calculations dialog box, set up for calculations of potential temperature (‘theta’) and the density parameter Sigma-0.#
In the dialog box in Fig. 8 we have already selected the options to calculate the two parameters used most often by physical oceanographers: potential temperature and a density-related parameter called ‘sigma-0’ or ‘sigma-theta’.
Oceanographic Note
Potential temperature, written as ‘Θ’ or ‘θ’ and therefore often called ‘theta’ by oceanographers (and abbreviated as THTA internally in Java OceanAtlas) is the temperature a seawater sample would have if raised adiabatically from its collection level (‘in situ’) to the sea surface. (In fully correct parlance this is ‘potential temperature with respect to zero decibars’.) The reason we use potential temperature can be illustrated by this example: If a seawater parcel descends into the deep ocean - perhaps because it entered from a peripheral region where it obtained a higher density than the ambient water in the region it entered - it is slightly heated by compression (by a little less than 0.1’C/1000 db increase in pressure). To properly compare temperatures of seawater samples from different pressures we should reference their temperatures to the same isobar. Zero decibars is the level of choice, though for density calculations potential temperature is calculated (automatically in Java OceanAtlas) with respect to the reference pressure chosen for the density calculation.
At this time oceanographers do not have generally available a satisfactory routine methodology for directly measuring density in situ with the accuracy and precision required for ocean circulation and mixing studies. So for many years oceanographers have calculated density based on seawater properties. Oceanographers are interested in the density of seawater for a number of reasons. For example, it is an important consideration in ocean mixing because it is easier to mix water along a surface of constant density (an ‘isopycnal’) rather than across it. [Consider the difference in work: To a first approximation it takes no work to mix along an isopycnal whereas it does require work to mix across one.] And oceanographers have learned that on a rotating Earth the relative motion of one seawater layer with respect to another sets up small-but-important slopes of isopycnal surfaces with respect to isobaric ones, meaning that by studying the slopes of isopycnal surfaces (and other related dynamic surfaces) we can infer much about ocean circulation.
The density of seawater is a nonlinear function of its pressure, temperature, and salinity. To properly compare seawater samples one should reference their densities to the same isobar. Zero decibars (the sea surface) is the most common choice, but due to nonlinearities in the equation of state for seawater it is also common to use deeper reference levels, i.e. reference levels appropriate to the situations under examination.
The density of a seawater sample with pressure = 0 db, TEMP = 0°C, and salinity = 35 would be 1028.106 kg m³. Oceanographers subtract ‘1000’ from density as a form of short hand and call this ‘sigma’ units. When the reference level is zero decibars this becomes ‘sigma-0’ or sometimes ‘sigma-theta’ (two names for the same term; SIG0 internally in Java OceanAtlas). Thus our ‘0, 0, 35’ sample - which is already at the reference pressure of 0 decibars - has sigma-0 = 28.106.
Select ‘Parameters…’ from the Calculations menu. Click on the boxes for theta and sigma-0 (this is shown in Figure 8), then click ‘OK’. The computer will rapidly complete the calculations. When it is done you will notice that the Data Window now shows these two parameters, because these have now been calculated and temporarily stored for every sample in the section.