Example 2D: DPO Extra Topic; Map Projections
It is essentially impossible to accurately map large regions of the spherical Earth onto flat maps. Many different attempts have been made to provide realistic and useful flat maps. The curved surface of the Earth must be projected onto a flat surface following a specified set of rules. Each ‘map projection’ is optimized for a particular use or set of uses.
Java OceanAtlas offers a small set of map projections, which will be explored next.
Files that may be needed or created in this example:
SIO.joa
mycity.joa
Tip
In the Java OceanAtlas Configure Map Plot dialog box there is a list of projection choices available under Projection/Region in the upper left corner of the window.
Exercise 2D-01: Map Projections - Analyzing Different Map Projections
In Java OceanAtlas, with the SIO.joa data file open (or your mycity.jos file made in Example 2E), and with a World map plot on the screen as in 2A, try each of the following projections, available from the Configure Map Plot window (see note below before making the plots):
Orthographic
Mollweide
Lambert azimuthal equal-area
Stereographic
Note
If you initiate a JOA map plot and simply hit Plot without changing anything in the Configure Map Plot dialog box, you will get a Mercator World Map. But if you select the Orthographic, Mollweide, Lambert Azimuthal Equal Area, or Stereographic projection, then hit Plot, you will get a blank map plot. This is because these four JOA map projections work only if you also select a Plot Region via that dialog box.
Regarding Plot Region, choices of the World 160W Center (Pacific), World 120E Center (Indian), or World 60W Center (Atlantic) preset map regions will produce useful results with any JOA map projections except the North and South pole projections.
What are a few telling aspects of each projection?
Hint
Place sufficient latitude and longitude lines on the map (if necessary change their interval in the Configure Map Plot dialog box) to see both how the lines appear (straight versus curved) and also how they are relatively spaced north-south and east-west on the map plot.
Hint
If the plot used for this projection comparison is not a World map plot, be sure to make the area of the Earth covered by the plot sufficiently large to include an entire ocean basin.
Exercise 2D-02: Polar Projections
To view the global ocean from the perspective of the poles, set up a map plot with a polar projection.
Below is a Configure Map Plot dialog box set up to provide a view of the oceans north of 40°N from a North Pole perspective:
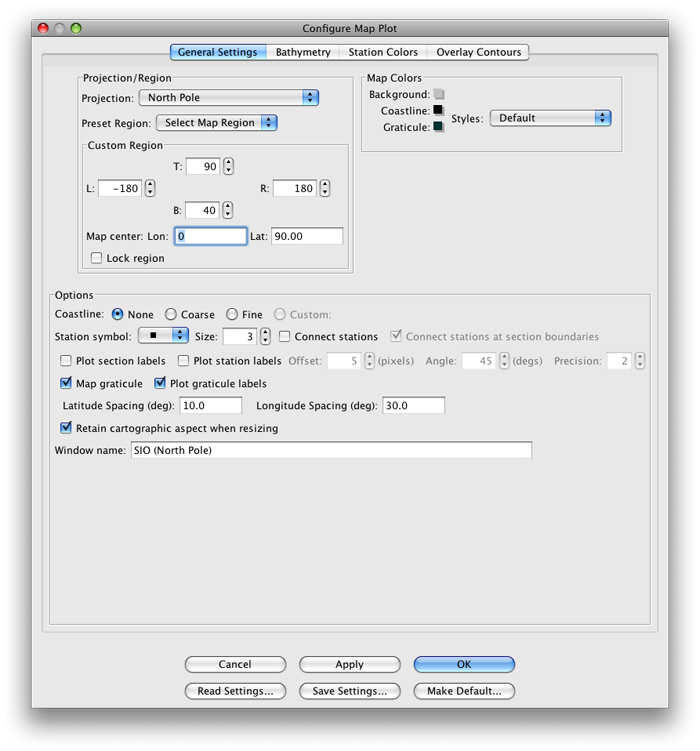
FIG 2d-01 Selecting a polar projection in the Configure Map Plot dialog box
Hint
Don’t forget to make the most equatorward latitude line plotted, i.e. the bottom of the map plot, 40°N by entering ‘40’ for ‘B’ under Custom Region.
The resulting plot looks like this:
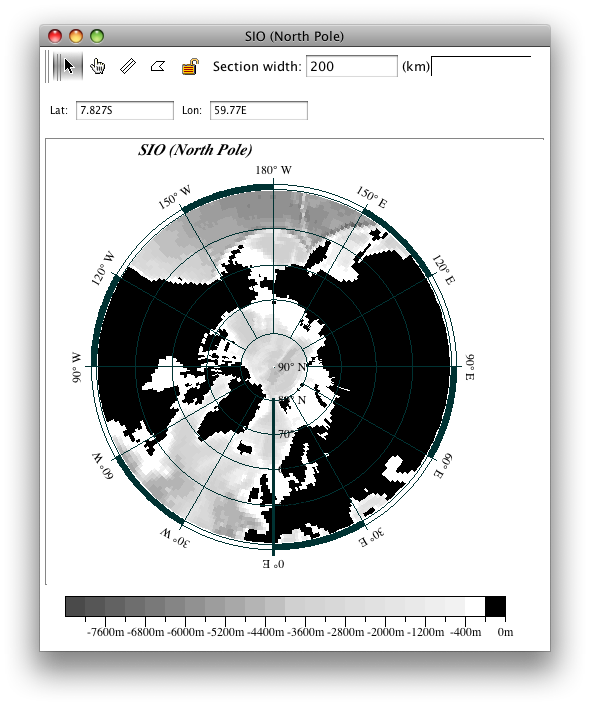
FIG 2d-02 Map plot with a polar projection
Now make a second map plot, for the Southern Ocean this time, from the perspective of the South Pole (JOA allows more than one map plot at a time)
Hint
On the South Pole map make the most equatorward latitude line plotted, i.e. the top of the map plot, 40°S by entering ‘-40’ for ‘T’ under Custom Region.
Examine
Compare the two Southern and Arctic Oceans plots:
What are the fundamental features and differences of the Arctic Ocean and Southern Ocean?
To which ocean does the Arctic Ocean have its primary bathymetric connection (i.e. its principal channels for exchange of waters)?
Speculate about the primary ocean circulation feature of the Southern Ocean.
Speculate about aspects of the Southern Ocean’s interactions with the other oceans.