Example 6F: Plotting Map of Average of Properties Between Two Surfaces
JOA can also calculate the average of any parameter between two surfaces. Sometimes this is useful when one is trying to visualize distributions of an identifiable layer of water.
Here we will look at the distribution of the weighted mean oxygen concentration between 250 and 750 decibars in the WOA05_NorthAtlantic_square.joa data file.
Files that may be needed or created in this example:
WOA05_NorthAtlantic_square.joa
Exercise 6f-01
Continue from 6E-01:
Calculations → Station Parameters → Integration…
Set up the Station Integration Calculations panel for a calculation of the weighted mean of O2 (dissolved oxygen) with respect to PRES (pressure) from 250 to 750 decibars over each profile as shown below:
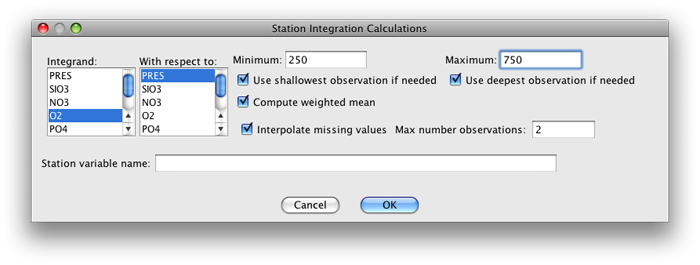
Fig 6f-01 Station Integration Calculations dialog box
Click OK, the result will appear in the Data Window
With the open Orthographic Map Plot in the foreground, bring up the Configure Map Plot dialog box:
Double-click or control-click on a map plot
Or type [ctrl/cmd]-R or Edit → Edit: plotname when a map plot is the front-most window
Select the Station calculation values sub-panel of the Station Colors panel
A list of all available station calculations will be shown. Select INT(O2-PRES,250.0-750.0)-td and then select the O2-global_cbr.xml color bar, as shown below:
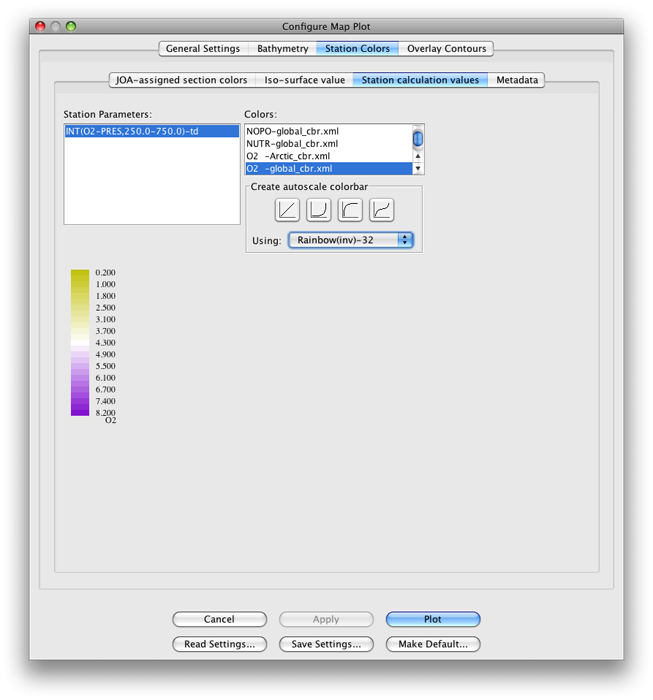
Fig 6f-02 Station Calculation Values sub-panel of Station Colors panel of the Configure Map Plot dialog box
Click OK to get this updated plot:
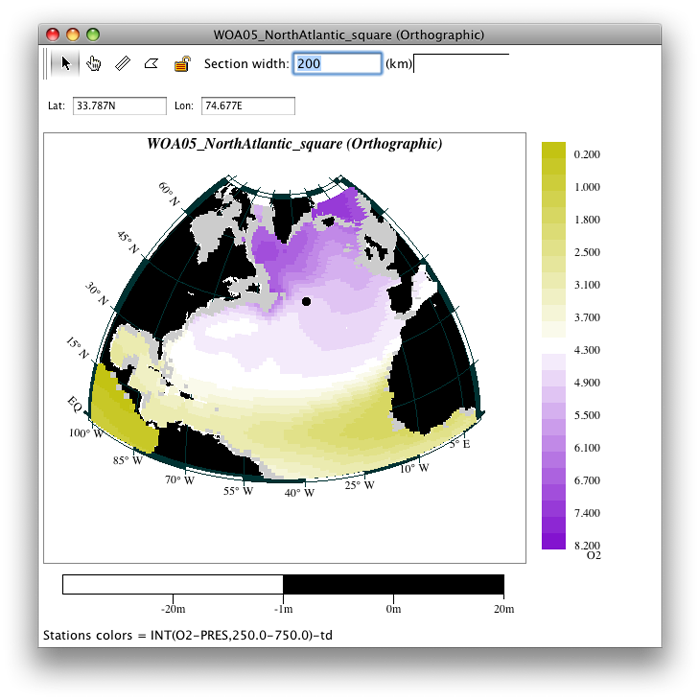
Fig 6f-03 Orthographic plot
Examine
This plot provides a clear illustration of the ventilation (oxygenation) of the Northern North Atlantic Ocean from the Labrador Sea and the Nordic Seas, with high oxygen waters spreading away from these regions. Note also the oxygen minima in the tropics, cut through in the equatorial zone due to the effects of equatorial upwelling.
Learn More
A Virtual Research Cruise
The oceanographic data used in the JOA DPO Examples come from hundreds of oceanographic research cruises. These cruises take months (usually years) of planning, then measurement specialists come together from different institutions and sometimes different countries, a research ship is readied, the work is done at sea, the data are processed at sea and ashore, and the data and related documentation are released for scientific use.
It all begins with proposals from scientists to the agencies that support their work. The proposal identifies the science goals, the work to be done, the resources (people, equipment, supplies, and ship time) required, and the intended data and distribution of the data. Once the proposal is accepted for funding (this can take several iterations), ship time must be obtained. Oceanographic research ships are busy and expensive to operate, and scheduling the required ship time can take one or more years. The Chief Scientist meanwhile works with the ship operator and the various measurement teams to bring everything together at the appointed start port and date.
The work at sea is organized carefully to bring about maximum scientific advantage with efficiency and close attention to safety. The scientific team is organized by measurement speciality, e.g., CTD operations, salinity/oxygen/nutrient chemistry, carbon chemistry, CFCs, Acoustic Doppler Current Profiling, data processing, etc., with a chief and co-chief scientist in charge overall. Typically each person works about 12 hours per day, every day of the week, until the work is done.
The data themselves are carefully standardized and closely checked at sea and ashore for suitability, quality, and error. Often a “data quality code” is attached to each reported data value. Cruise documentation must be sufficient to inform a data user - perhaps many years in the future - of all information necessary to understand the origin, calibration, and quality of the data.
To provide a view of a research cruise of the type that generates typical data used in the JOA DPO Examples, we have assembled text, photo, and video files - most from the 2007 “I8S” cruise of R/V Roger Revelle - into a virtual research cruise from proposal to final data report. This can be found at https://joa.ucsd.edu/outreach/virtualcruise/